Radiomic-Feature-Standards | Standardization in Quantitative Imaging: A Multi-center Comparison of Radiomic Feature Values
DOI: 10.7937/tcia.2020.9era-gg29 | Data Citation Required | 446 Views | 2 Citations | Analysis Result
| Location | Subjects | Size | Updated | |||
|---|---|---|---|---|---|---|
| Lung Cancer | Chest, Lung Phantom | 13 | Multi-center comparison of radiomic features. | 2020/06/09 |
Summary
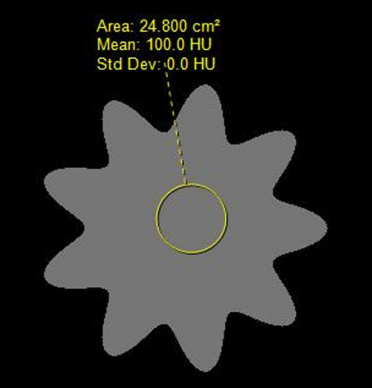
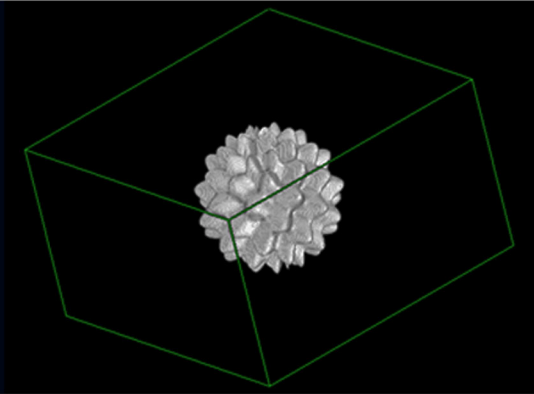
This dataset was used by the NCI’s Quantitative Imaging Network (QIN) PET-CT Subgroup for their project titled: Multi-center Comparison of Radiomic Features from Different Software Packages on Digital Reference Objects and Patient Datasets. The purpose of this project was to assess the agreement among radiomic features when computed by several groups by using different software packages under very tightly controlled conditions, which included common image data sets and standardized feature definitions. The image datasets (and Volumes of Interest – VOIs) provided here are the same ones used in that project and reported in the publication listed below (ISSN 2379-1381 https://doi.org/10.18383/j.tom.2019.00031). In addition, we have provided detailed information about the software packages used (Table 1 in that publication) as well as the individual feature value results for each image dataset and each software package that was used to create the summary tables (Tables 2, 3 and 4) in that publication. For that project, nine common quantitative imaging features were selected for comparison including features that describe morphology, intensity, shape, and texture and that are described in detail in the International Biomarker Standardisation Initiative (IBSI, https://arxiv.org/abs/1612.07003 and publication (Zwanenburg A. Vallières M, et al, The Image Biomarker Standardization Initiative: Standardized Quantitative Radiomics for High-Throughput Image-based Phenotyping. Radiology. 2020 May;295(2):328-338. doi: https://doi.org/10.1148/radiol.2020191145). There are three datasets provided – two image datasets and one dataset consisting of four excel spreadsheets containing feature values. Software Package details : This table contains detailed information about the software packages used in the study (and listed in Table 1 in the publication) including version number and any parameters specified in the calculation of the features reported. DRO results : This contains the original feature values obtained for each software package for each DRO as well as the table summarizing results across software packages (Table 2 in the publication) . Patient Dataset results: This contains the original feature values for each software package for each patient dataset (1 lesion per case) as well as the table summarizing results across software packages and patient datasets (Table 3 in the publication). Harmonized GLCM Entropy Results : This contains the values for the “Harmonized” GLCM Entropy feature for each patient dataset and each software package as well as the summary across software packages (Table 4 in the publication).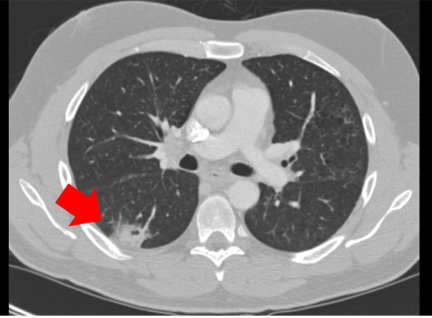
Data Access
Version 1: Updated 2020/06/09
| Title | Data Type | Format | Access Points | Subjects | License | Metadata | |||
|---|---|---|---|---|---|---|---|---|---|
| Segmentation | Segmentation | NIFTI and ZIP | CC BY 3.0 | — | |||||
| Feature Variability Software Package details | Other | XLSX | CC BY 3.0 | — | |||||
| DRO Results | Radiomic Feature | XLSX | CC BY 3.0 | — | |||||
| Patient Dataset Results | Radiomic Feature | XLSX | 10 | CC BY 3.0 | — | ||||
| Harmonized GLCM Entropy Results | Radiomic Feature | XLSX | 10 | CC BY 3.0 | — |
Collections Used In This Analysis Result
| Title | Data Type | Format | Access Points | Subjects | License | Metadata | |||
|---|---|---|---|---|---|---|---|---|---|
| Corresponding Original CT images from LIDC-IDRI and DRO-Toolkit | CT | DICOM | Requires NBIA Data Retriever |
13 | 13 | 13 | 3,854 | CC BY 3.0 | View |
| Corresponding second-generation SEG images from QIN-LungCT-Seg | SEG | DICOM | Requires NBIA Data Retriever |
13 | 13 | 13 | 13 | CC BY 3.0 | View |
Citations & Data Usage Policy
Data Citation Required: Users must abide by the TCIA Data Usage Policy and Restrictions. Attribution must include the following citation, including the Digital Object Identifier:
Data Citation |
|
|
McNitt-Gray, M.*, Napel, S.*, Jaggi, A., Mattonen, S.A., Hadjiiski, L., Muzi, M., Goldgof, D., Balagurunathan, Y., Pierce, L.A., Kinahan, P.E., Jones, E.F., Nguyen, A., Virkud, A., Chan, H-P., Emaminejad, N., Wahi-Anwar, M., Daly, M., Abdalah, M., Yang, H., Lu, L., Lv, W., Rahmim, A., Gastounioti, A., Pati, S., Bakas, S., Kontos, D., Zhao, B., Kalpathy-Cramer, J., Farahani, K. (2020). Data from the Standardization in Quantitative Imaging: A Multi-center Comparison of Radiomic Feature Values [Data set]. The Cancer Imaging Archive. DOI: https://doi.org/10.7937/tcia.2020.9era-gg29. |
Acknowledgement |
|
|
Acknowledgement |
|
|
Acknowledgement |
|
|
Acknowledgement |
|
|
Acknowledgement |
|
|
Acknowledgement |
|
|
Acknowledgement |
|
|
Acknowledgement |
|
|
Acknowledgement |
|
|
Acknowledgement |
|
|
Acknowledgement |
|
|
Detailed Description
Patient IDs for the 3 DROs from (https://doi.org/10.7937/t062-8262)
Phantom-100.0-1.0-1.0-1.0-9.0-0.0-100.0-10.0-0.0-0.0
Phantom-100.0-1.0-1.0-1.0-9.0-0.0-100.0-10.0-50.0-0.0
Phantom-100.0-1.0-1.0-1.0-9.0-0.2-100.0-10.0-0.0-0.0
Patient IDs for the 10 LIDC-IDRI subjects (https://doi.org/10.7937/K9/TCIA.2015.LO9QL9SX)
LIDC-IDRI-0314
LIDC-IDRI-0325
LIDC-IDRI-0580
LIDC-IDRI-0766
LIDC-IDRI-0771
LIDC-IDRI-0811
LIDC-IDRI-0905
LIDC-IDRI-0963
LIDC-IDRI-0965
LIDC-IDRI-1012
Additional options for download:
| DRO Data (3 subjects) | Download all or Query/Filter |
|---|---|
| Image Data (DICOM, 452.0 MB)
CT only |
|
| Segmentation Data – DSO (DICOM, 29.0 MB) | |
| Segmentation Data – (NIfTI, zip, 926 KB) |
| Patient Datasets (10 subjects) | Download all or Query/Filter |
|---|---|
| Image Data (DICOM, 1.0 GB)
CT only |
|
| Segmentation Data – (DICOM, 94 MB) | |
| Segmentation Data – (NIfTI, zip, 21.0 KB) |
Acknowledgements
The authors gratefully acknowledge the following sources of support:
- The National Cancer Institute Quantitative Network (QIN)
Related Publications
Publications by the Dataset Authors
The authors recommended the following as the best source of additional information about this dataset:
Publication Citation |
|
|
McNitt-Gray, M., Napel, S., Jaggi, A., Mattonen, S.A., Hadjiiski, L., Muzi, M., Goldgof, D., Balagurunathan, Y., Pierce, L.A., Kinahan, P.E., Jones, E.F., Nguyen, A., Virkud, A., Chan, H-P., Emaminejad, N., Wahi-Anwar, M., Daly, M., Abdalah, M., Yang, H., Lu, L., Lv, W., Rahmim, A., Gastounioti, A., Pati, S., Bakas, S., Kontos, D., Zhao, B., Kalpathy-Cramer, J., Farahani, K. (2020). Standardization in Quantitative Imaging: A Multi-center Comparison of Radiomic Feature Values, Tomography. https://doi.org/10.18383/j.tom.2019.00031. |
Research Community Publications
TCIA maintains a list of publications that leveraged this dataset. If you have a manuscript you’d like to add please contact TCIA’s Helpdesk.