NLST-New-lesion-LongCT | New Lung Lesions in Low-dose CT: a newly annotated longitudinal dataset derived from the National Lung Screening Trial
DOI: 10.7937/eyvh-ag54 | Data Citation Required | Analysis Result
| Location | Subjects | Size | Updated | ||
|---|---|---|---|---|---|
| Lung Cancer | Lung | 119 | 2025/07/08 |
Summary
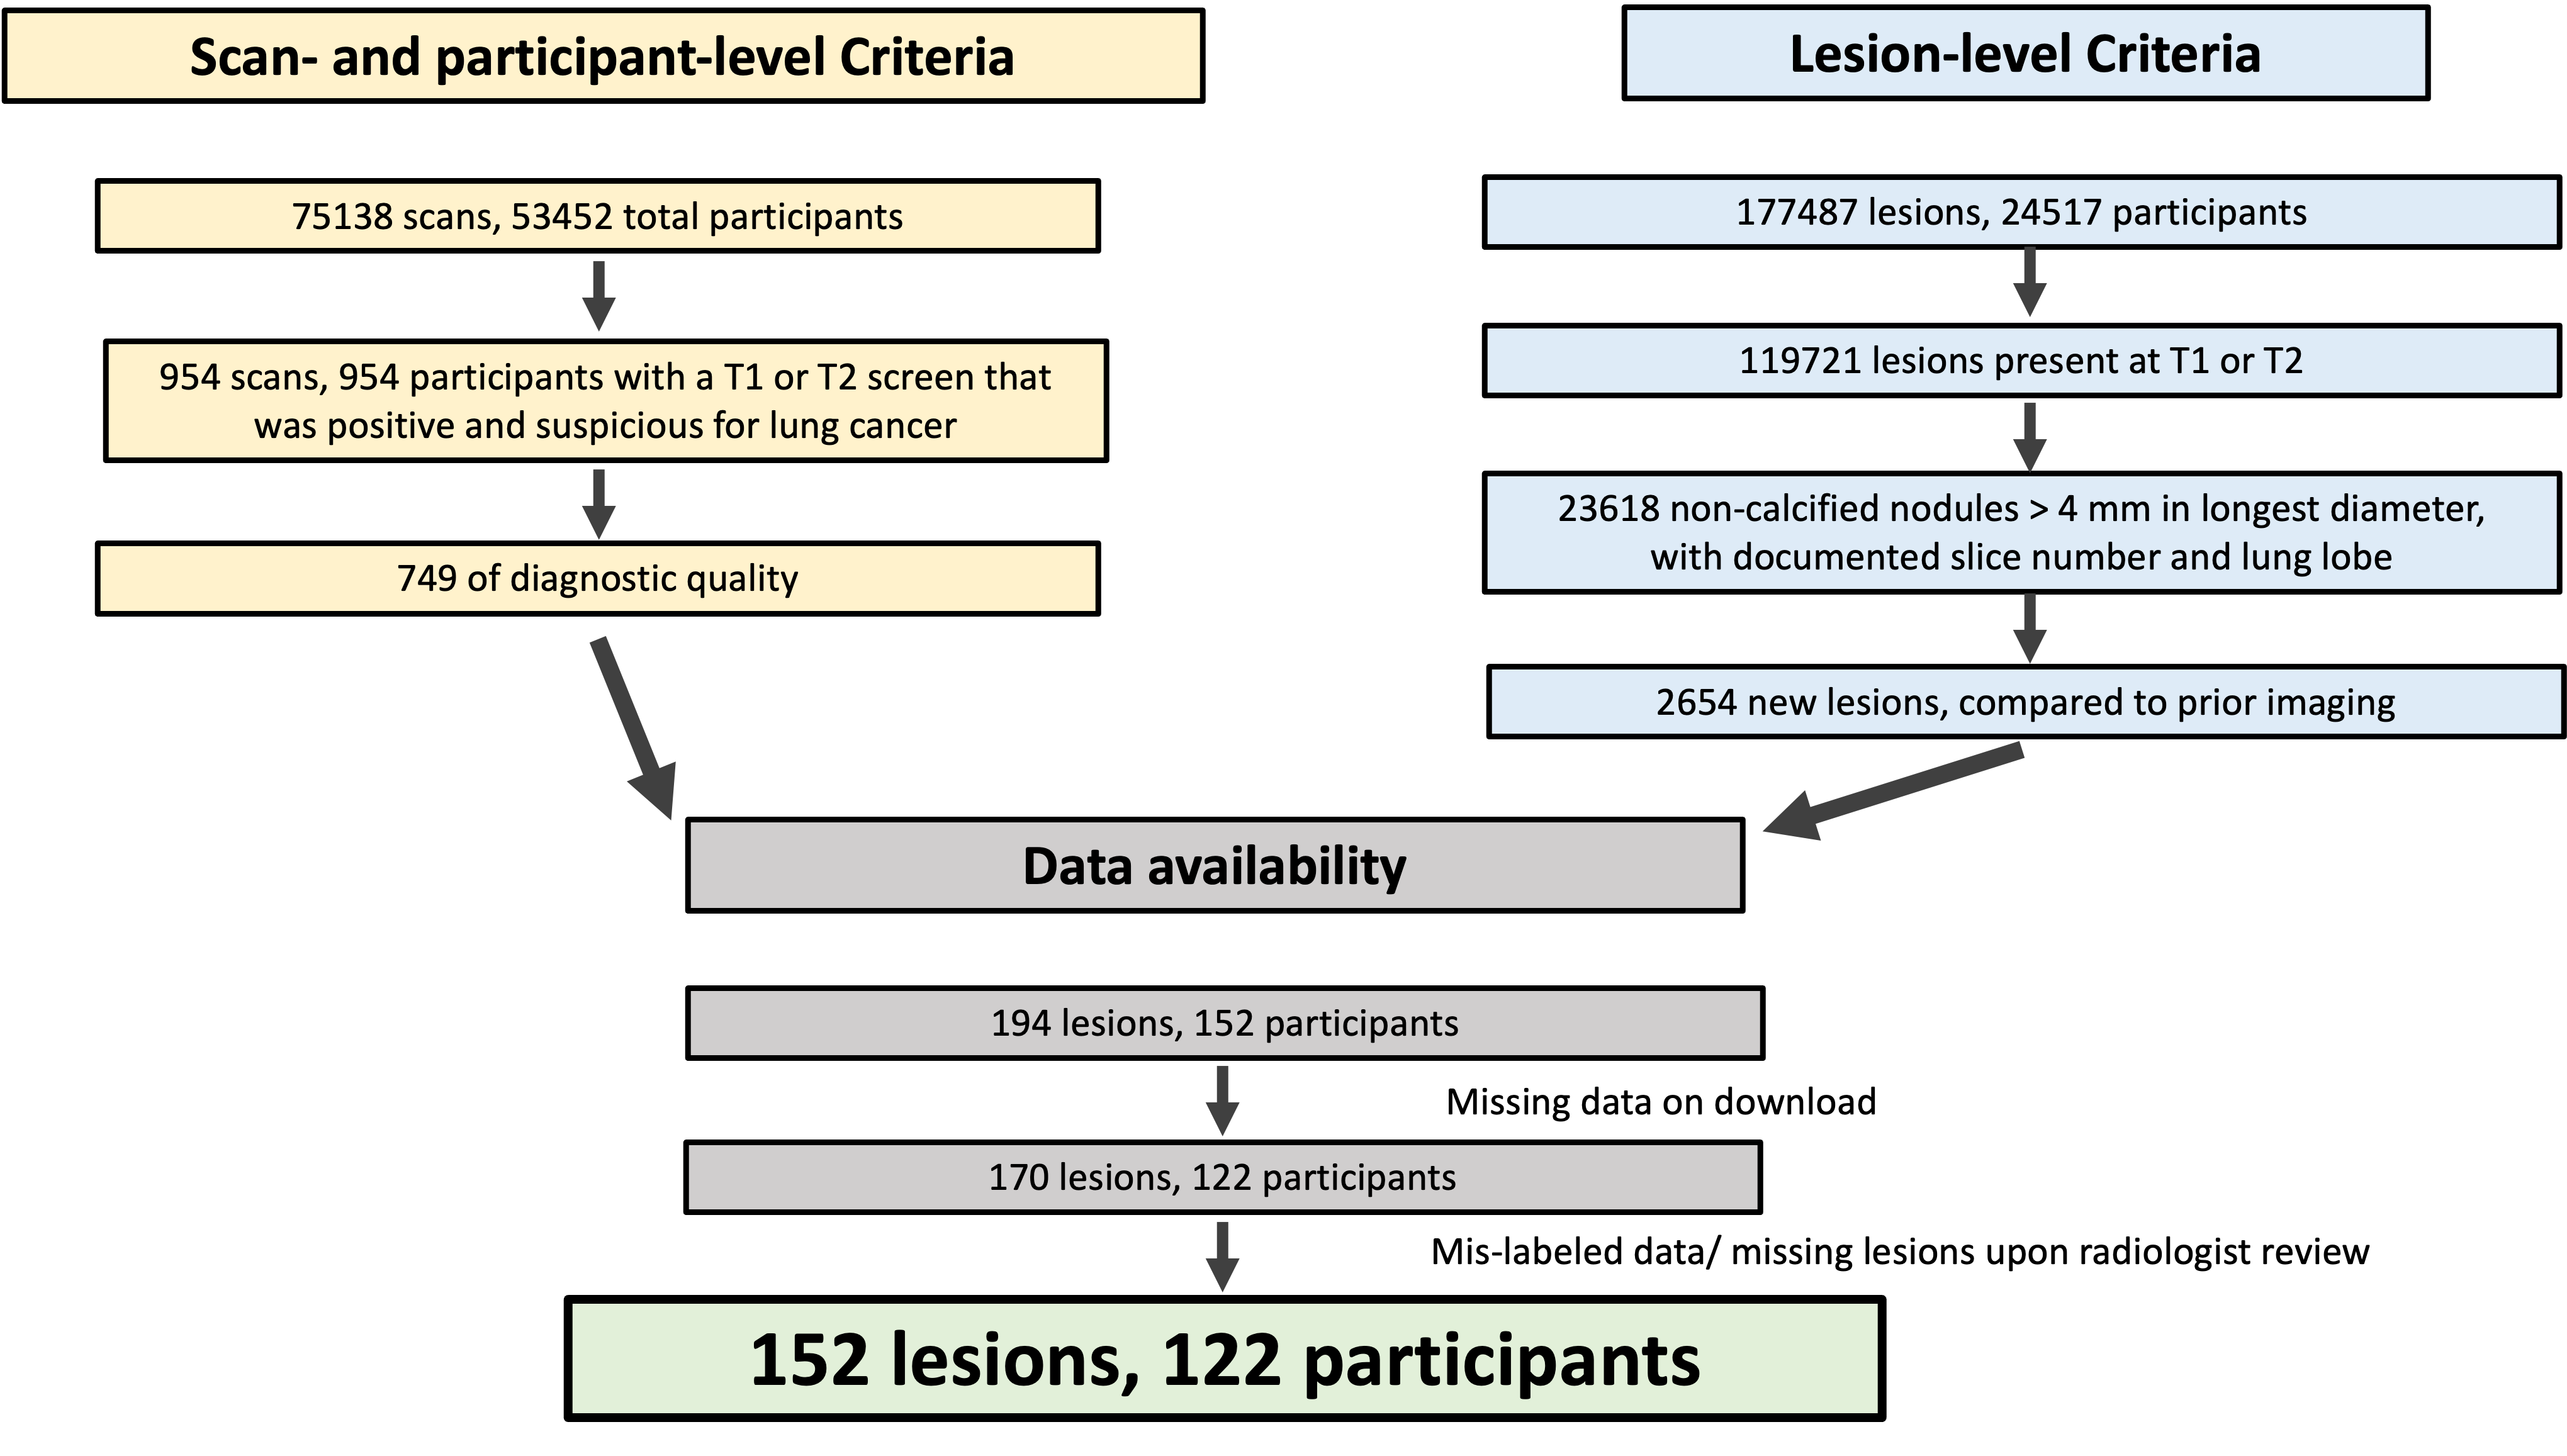
The National Lung Screening Trial is an influential publicly available medical image dataset that has fueled a breadth of work in lesion detection. Strengths of this trial include its multi-institutional nature and the standardization of data collection. One limitation of the original dataset, however, is the lack of image labels such as lesion annotations. We introduce an annotated derivative dataset of 152 lung lesions in 126 scans from 122 participants. These lesions were identified by radiologists during the trial as new compared to prior imaging and suspicious for malignancy. We provide point annotations, image coordinates, and registered baseline CT images for each identified new lesion. This addresses a gap in labeled longitudinal public datasets that capture the development of new lesions, and supports the development of automated tools in lesion detection that leverage temporal information in longitudinal imaging studies. The detection of new lesions in cross-sectional imaging is a time- and resource-intensive task in cancer imaging and has a pivotal role in a variety of clinical applications, including lung cancer screening. Automated tools have enormous potential to improve the efficacy and efficiency of new lesion detection in clinical practice; however, there remains a gap in labeled longitudinal public image datasets that are critical in the development and evaluation of such tools. While public data are available to train convolutional neural networks (CNNs) for lesion detection at a single time point, there is relative paucity of large, annotated, longitudinal public datasets (multiple timepoints) with new lesions from a lesion-negative baseline image. One essential strength of the National Lung Screening Trial (NLST) (see also 10.1056/NEJMoa1102873 , cdas nlst ) was the standardized collection of clinical, image, and lesion data, in addition to the size and multi-institutional nature of the trial. We utilized standardized characteristics of lesions that were identified by radiologists during the trial to select a subset of lesions that were marked as new compared to prior image timepoints. We provide point annotations for each lesion in this subset, as well as the corresponding baseline CT image that is registered to the follow-up time point of interest for ease of comparison. By capturing the development of new lesions, our newly annotated dataset helps to address the gap in labeled longitudinal public image datasets; this may support the development of automated tools in lesion detection that leverage temporal information in longitudinal (multi-time point) imaging studies. The following subsections provide information about how the data were selected, acquired and prepared for publication, approximate date range of imaging studies. To identify participants, scans, and lesions of interest, we utilized standardized clinical datasets (described by dataset dictionaries) that are available in the original TCIA collection (see also 10.7937/TCIA.HMQ8-J677). This clinical dataset describes abnormalities on low-dose CT that were identified by radiologists during the trial, and include lesion location, size, attenuation, and findings on comparison with prior scans. The 122 participants in the final cohort with annotated new lesions were 61.8 +/- 5.1 (mean +/- S.D.) years of age; 57 were male and 65 were female. 116 (95.1%), 4 (3.2%), 1 (0.8%), and 1 (0.8%) participants reported their race as “White”, “Black”, “Native Hawaiian or Other Pacific Islander”, and “More than one race”, respectively; none reported their race as “Asian”. To identify lesions of interest, we used a subset of clinical variables defined by the original trial in data dictionaries (Figure 1). We included lesions that were identified on diagnostic-quality CT scans (ctdxqual). Of three screening timepoints (study years 0, 1, and 2), we selected the subset of lesions that were identified on study years 1 or 2 (follow-up), that were new compared to imaging acquired earlier in the study (does not preexist) and included a specified slice number and lung lobe (sct_slice_num and sct_epi_loc). All lesions in this subset were “Non-calcified nodule or mass (opacity >= 4 mm diameter)”, as slice number was only recorded for lesions of this type. We characterized the selected lesion subset by longest and perpendicular diameter in the indicated slice (sct_long_dia and sct_perp_dia), lesion margins (sct_margins e.g. spiculated, smooth, poorly defined), and attenuation/ subtype (sct_pre_att e.g. “ground glass”, “soft tissue”, “mixed”). We describe participant demographics of this cohort by age, sex, and race, based on clinical data available on the TCIA collection. At the lesion-level, of 177,487 total abnormalities were identified in 24,517 participants throughout the study. 59,283 and 60,438 abnormalities were documented at T1 and T2, respectively; of those, 11,726 and 11,892 abnormalities were non-calcified nodules > 4mm in longest diameter, all of which included a documented slice number and lung lobe. Of those nodules with documented slice number, 1372 and 1282 were new compared to prior imaging (not preexisting) at T1 and T2, respectively; of these, 2587 (97.5%) lesions were identified on scans that were of diagnostic quality. We then apply criteria at the level of the screening time point. Of 26453 participants in the low-dose CT arm of the trial, 954 (1.8%) participants had a screen that was positive and suspicious for lung cancer at T1 and none had positive screens suspicious for lung cancer at T2. Of the 954 scans at T1, 749 (78.5%) were of diagnostic quality. Notably, of 75138 total scans, 73062 scans (97.2%) were of diagnostic quality with similar proportions at T1. 194 lesions in 152 participants that satisfied all lesion- and screen-level criteria. A subset of these were included in the final set due to the number of scans available on download from the original NLST collection, as well as lesions that were described in the clinical dataset but not identifiable in the labeled image. Participants with missing screening time points were excluded from our dataset to ensure that the CT images used were accurately correlated to the time points and lesions described in the clinical datasets. 170 lesions in 132 participants had all expected time points available on download from TCIA. Of those, 152 lesions in 122 participants were identified on the CT series indicated by the clinical dataset and were subsequently annotated with a point marking. The selection of 152 annotated new lesions in our derivative dataset as described in the figure was determined by three sets criteria: lesion-level, scan-level, and data availability. “missing data on download” refers to the exclusion of CT data from patients that were missing CT data from at least one of three imaging timepoints; these timepoints were documented in the clinical data forms, but not present on download from the original collection. Mis-labeled data refers to CT images whose files correlated with screening timepoint descriptors in the clinical data forms but were inconsistent with described lesions, when reviewed by expert radiologist KR. 103 (67.8%), 34 (22.4%), 14 (9.2%), and 1 (0.7%) of the lesions were described as soft tissue, ground glass, mixed, or other; there were no fat or fluid/water lesions in this derivative dataset. The longest diameter for the annotated lesions was 9.4 +/- 5.8mm (mean +/- std) and ranged from 4.0 to 41.0 mm (Table 1 under Detailed Description). All lesions in this subset had a longest diameter > 4.0 mm, per selection criteria. We used the CT reconstruction filter specified in the DICOM header to select one image series from each timepoint for registration. Standard reconstruction (including GE Standard”, “Phillips C”, “Siemens B30”, and “Toshiba FC10”) was selected when available to improve the quality of registration and optimize homogeneity in image reconstruction parameters in the provided registered baseline images. Importantly, the choice of reconstruction kernel does not impact the new lesion image coordinates for this dataset. Rather, consistent reconstruction filters between baseline and follow-up improves the quality of registration between pairs of timepoints. Homogeneity in image reconstruction parameters across baseline images for this dataset may also benefit downstream development of automated tools using this dataset. New lesion image coordinates were manually identified and marked on each image by A.G. and K.R. At the time of annotation, A.G. was senior medical student with oversight from board-certified radiologist, K.R., who has fellowships in abdominal and thoracic imaging and 8 years of clinical experience. Point annotations were made using the open-source image segmentation software ITK-SNAP. For each CT scan containing a new lesion (follow-up), we identified the baseline CT scan (baseline) that immediately preceded the follow up by approximately one year, according to NLST protocol (see also 10.7937/TCIA.HMQ8-J677 , 10.1056/NEJMoa1102873 ). DICOM files from the original NLST collection were converted to NIfTI files using Simple ITK, then resampled images to 1.0×1.0x1.0mm voxels, and applied a CT window of -1000 : 1000 Hounsfield units. We registered each preprocessed image with the corresponding follow-up image with sequential translation, affine, and B-spline transformations using Elastix, (Klein et al 2010) an open-source medical image registration library that is integrated into the open source image analysis toolkit, Simple ITK , (Yaniv et al 2018) Our collection includes the registered baseline image. We do not include copies of the follow-up image on which the new lesion was annotated, as these are already available in the original NLST collection. We verified our point annotations and image coordinates by automatically checking the slice number of the annotation with the slice number specified in the clinical datasets. K.R. then conducted a manual review of each lesion annotation to verify that the annotated lesion matched the lesion documented in the standardized clinical datasets. A.G. subsequently compared each annotated follow-up image with both original and registered versions of the baseline image. Select discrepancies between clinical datasets and observed image and lesion characteristics are discussed in Usage Notes. Naming conventions match those defined by the original trial when possible. Data organization and directory names match those of the original collection, as defined upon download using the NBIA Data Retriever. Each registered baseline image filename is composed of abbreviated filenames from each timepoint and separated by an underscore. For a single DICOM filename from the original collection, the abbreviated filename includes the first and last 5 digits of the DICOM file names, which matches the last 5 digits of the SeriesInstanceUID. For example, for a baseline scan from pid 110494, study year 1, the SeriesInstanceUID is “1.2.840.113654.2.55.216791194357303579492757053288225818239” and DICOM filename is “2.000000-0OPASEVZOOMB50f280212080.040.0null-18239” upon download from the original collection. The abbreviated filename is “2-18239”. The follow up image for this scan is abbreviated in similar fashion as “3-32738”. The registered baseline image from this pair is then named “2-18239_3-32738.nii.gz”. This file resides in the subdirectory “regoutdir” as described below. Pseudo-new lesions: Although all annotated lesions were marked by radiologists during the trial to be new compared to prior scans, a subset of lesions on A.G. review did appear to be present at baseline – what we define as “pseudo-new lesions”. One source of these discrepancies may be due to radiologists’ identification of clinically significant new lesions – ie. lesions that were present on baseline scans but not marked as new at that time may have subsequently changed in size or quality such that they were marked as new at a later time point. PID 200866, Year 1: NLST data dictionaries describe the longest diameter of this lesion to measure 26 mm. On review by K.R, the longest diameter measures 16 mm. PID 203473, Year 2: NLST data dictionaries describe the lesion to reside in the lung’s right middle lobe. On review by K.R, the finding is in the lung’s right lower lobe. The baseline scan is available for lesion annotation on PID 203014, Year 1: Although this lesion is described in clinical data forms as new compared to prior, and which was identified on a follow-up image time point (Timepoint 2, “Year 1”) was missing a baseline image in the original download from the NLST collection. The registered baseline image (Timepoint 1, “Year 0”) is not available as this image is not available in the original collection. To visualize CT scans and to annotate lesions and export as NIfTI files, we used ITK-SNAP 6 version 4.2.0 (www.itksnap.org , see also Yushkevich et al 2006). We verified the orientation of images and annotations by visualizing samples with 3D Slicer 7 (see also Fedorov et al 2012). For image preprocessing, we used Simple ITK 5 version 2.4.0. For image registration, we used the ElastixImageFilter class within Simple ITK, which wraps the Elastix 4 image registration library.Abstract
Introduction
Methods
Subject Inclusion and Exclusion Criteria
Data Analysis
Lesion Selection: Overview
Lesion Selection: Detailed
Lesion Characteristics
Selection of CT reconstruction filter
Image Annotations
Image Preprocessing and Registration with Baseline CT
Quality Control and Validation
Usage Notes
Data Organization and Naming Conventions
Variables
Discrepancies between NLST-documented and observed lesion characteristics
Registered Baseline Image
Image Visualization
External Resources
Data Access
Version 1: Updated 2025/07/08
| Title | Data Type | Format | Access Points | Subjects | License | Metadata | |||
|---|---|---|---|---|---|---|---|---|---|
| CT and point annotation images | Fiducial, CT | NIFTI | Download requires IBM-Aspera-Connect plugin |
119 | 0 | 758 | CC BY 4.0 | — | |
| Transfer list of paths names and abbreviations | Other | CSV | CC BY 4.0 | — | |||||
| Point annotations | Fiducial | XLSX | CC BY 4.0 | — | |||||
| Registered Pairs of Images | Other | XLSX | CC BY 4.0 | — |
Collections Used In This Analysis Result
| Title | Data Type | Format | Access Points | Subjects | License | Metadata | |||
|---|---|---|---|---|---|---|---|---|---|
| Source Images from NLST | CT | DICOM | 119 | 242 | 242 | 50,031 | — |
Citations & Data Usage Policy
Data Citation Required: Users must abide by the TCIA Data Usage Policy and Restrictions. Attribution must include the following citation, including the Digital Object Identifier:
Data Citation |
|
|
Gong, A., Daly, M., Goldin, J., Brown, M., McNitt-Gray, M., Ruchalski, K. (2025) New Lung Lesions in Low-dose CT: a newly annotated longitudinal dataset derived from the National Lung Screening Trial Dataset (NLST-New-lesion-LongCT) Version 1 [Dataset]. The Cancer Imaging Archive. DOI: 10.7937/eyvh-ag54 |
Detailed Description
Table 1: Lesion Longest Diameter (mm): summary statistics by lesion subtype
Lesion subtype was described as their “predominant attenuation” in the NLST clinical data forms.
| Lesion Sub-type(s) | Number of lesions | Mean | Standard deviation | Minimum | Maximum |
| Ground glass |
34 |
9.15 | 3.12 | 4 |
16 |
| Soft Tissue |
103 |
9.32 | 5.97 | 4 |
41 |
|
Mixed |
14 | 9.57 | 6.93 | 4 |
30 |
| Other |
1 |
30 | 0 | 30 |
30 |
| Soft Tissue, Mixed, or Other |
118 |
9.53 | 6.36 | 4 |
41 |
| All |
152 |
9.44 | 5.79 | 4 |
41 |
CSV variables
- In pointannotations_all_dicomslices_pnl.csv, each row describes a lesion annotation.
- pid: Participant Identifier, as defined by the NLST data dictionaries 1,3.
- study_yr: Study year of screen, starting from 0, as defined by the NLST data dictionaries.
- sct_ab_num: the lesion/abnormality number, starting from 1, as defined by the NLST data dictionaries.
- coord_x_pre, coord_y_pre, coord_z_pre: Image coordinates (in pixel) of the lesion point annotation. The spacing and image directions correspond to the original DICOM files from the full NLST collection. coord_z_pre refers to the slice index (starting from 0) of the annotated lesion (i.e. If “sct_slice_num” is the CT slice number (starting from 1) containing abnormality’s greatest diameter, as defined in the NLST data dictionaries, coord_z_pre = sct_slice_num – 1.
- norm_x , norm_y, norm_z: Normalized location of the lesion point annotation.
- pseudo_nl: binary value that indicates if the annotated lesion is a “pseudo-new lesion”, as discussed below. 0 indicates that this lesion was not present on the baseline scan on our review. 1 indicates that this lesion was present on the baseline scan on our review.
- In regpairs_all.csv, each row describes the pair of images defined as “baseline scan” and “follow-up scan”, in which one or more new lesions were annotated on the follow-up scan. For each pair of images that were registered:
- pid: as above.
- path_fu: relative pathname to the follow-up DICOM image.
- study_yr: study year as defined above, for the follow-up image.
- StudyInstanceUID_fu: StudyInstanceUID for the follow-up image.
- SeriesInstanceUID_fu: SeriesInstanceUID for the follow-up image.
- path_b: relative pathname to the baseline DICOM image.
- study_yr_b: study year as defined above, for the baseline image.
- StudyInstanceUID_b: StudyInstanceUID for the baseline image.
- SeriesInstanceUID_b: SeriesInstanceUID for the baseline image.
- regoutdir: relative path to a subdirectory that contains the registered baseline image and associated files.
References
-
- National Lung Screening Trial Research Team. Data from the National Lung Screening Trial (NLST). Published online 2013. DOI:10.7937/TCIA.HMQ8-J677
- The National Lung Screening Trial Research Team. Reduced Lung-Cancer Mortality with Low-Dose Computed Tomographic Screening. N Engl J Med. 2011;365(5):395-409. doi:10.1056/NEJMoa1102873
- Datasets – NLST – The Cancer Data Access System. Accessed April 6, 2025. https://cdas.cancer.gov/datasets/nlst/
- Klein S, Staring M, Murphy K, Viergever MA, Pluim J. elastix: A Toolbox for Intensity-Based Medical Image Registration. IEEE Trans Med Imaging. 2010;29(1):196-205. DOI: 10.1109/TMI.2009.2035616
- Yaniv Z, Lowekamp BC, Johnson HJ, Beare R. SimpleITK Image-Analysis Notebooks: a Collaborative Environment for Education and Reproducible Research. J Digit Imaging. 2018;31(3):290-303. DOI: 10.1007/s10278-017-0037-8
- Yushkevich PA, Piven J, Hazlett HC, et al. User-guided 3D active contour segmentation of anatomical structures: Significantly improved efficiency and reliability. NeuroImage. 2006;31(3):1116-1128. DOI: 10.1016/j.neuroimage.2006.01.015
- Fedorov A, Beichel R, Kalpathy-Cramer J, et al. 3D Slicer as an image computing platform for the Quantitative Imaging Network. Magn Reson Imaging. 2012;30(9):1323-1341. DOI: 10.1016/j.mri.2012.05.001
Acknowledgements
This work was supported by the Radiological Society of North America Research Medical Student Grant 2022 (RMS2209), the UCLA Department of Radiology, and the David Geffen Medical Scholarship.
Related Publications
Publications by the Dataset Authors
The authors recommended the following as the best source of additional information about this dataset:
Research Community Publications
TCIA maintains a list of publications that leveraged this dataset. If you have a manuscript you’d like to add please contact TCIA’s Helpdesk.